![]()
![]()
Search human-mouse co-expression difference here !
Please cite the following paper when you use coexpressMAP.
Di Liu, Linna Zhao, Yang Chen, Zhaoyang Wang, Jing Xu, Ying Li, Changgui Lei, Simeng Hu, Miaomiao Niu and Yongshuai Jiang. Comparison of the general co-expression landscapes between human and mouse. Brief Bioinform. 2017 Mar 14. doi: 10.1093/bib/bbx024.
Search human-mouse co-expression differece using a gene pair in human.
Note : the result is searched from 102681615 coexpression relationships. It may be a potentially slow. Please be patient.
Download data here !
Homology_human_mouse_gene information : homology_human_mouse_gene.zip (1.22M)
Human cor-expression value (sorted) : all_co-expression_value_human_sorted.zip (489M)
Mouse cor-expression value (sorted) : all_co-expression_value_mouse_sorted.zip (512M)
Human and mouse conserved gene : conserved_gene_co-expression_value_human_mouse_sorted.zip (421M)
Human general co-expression network : human general co-expression network.zip (10.06M)
Mouse general co-expression network : mouse general co-expression network.zip (10.42M)
Introduction about our Database
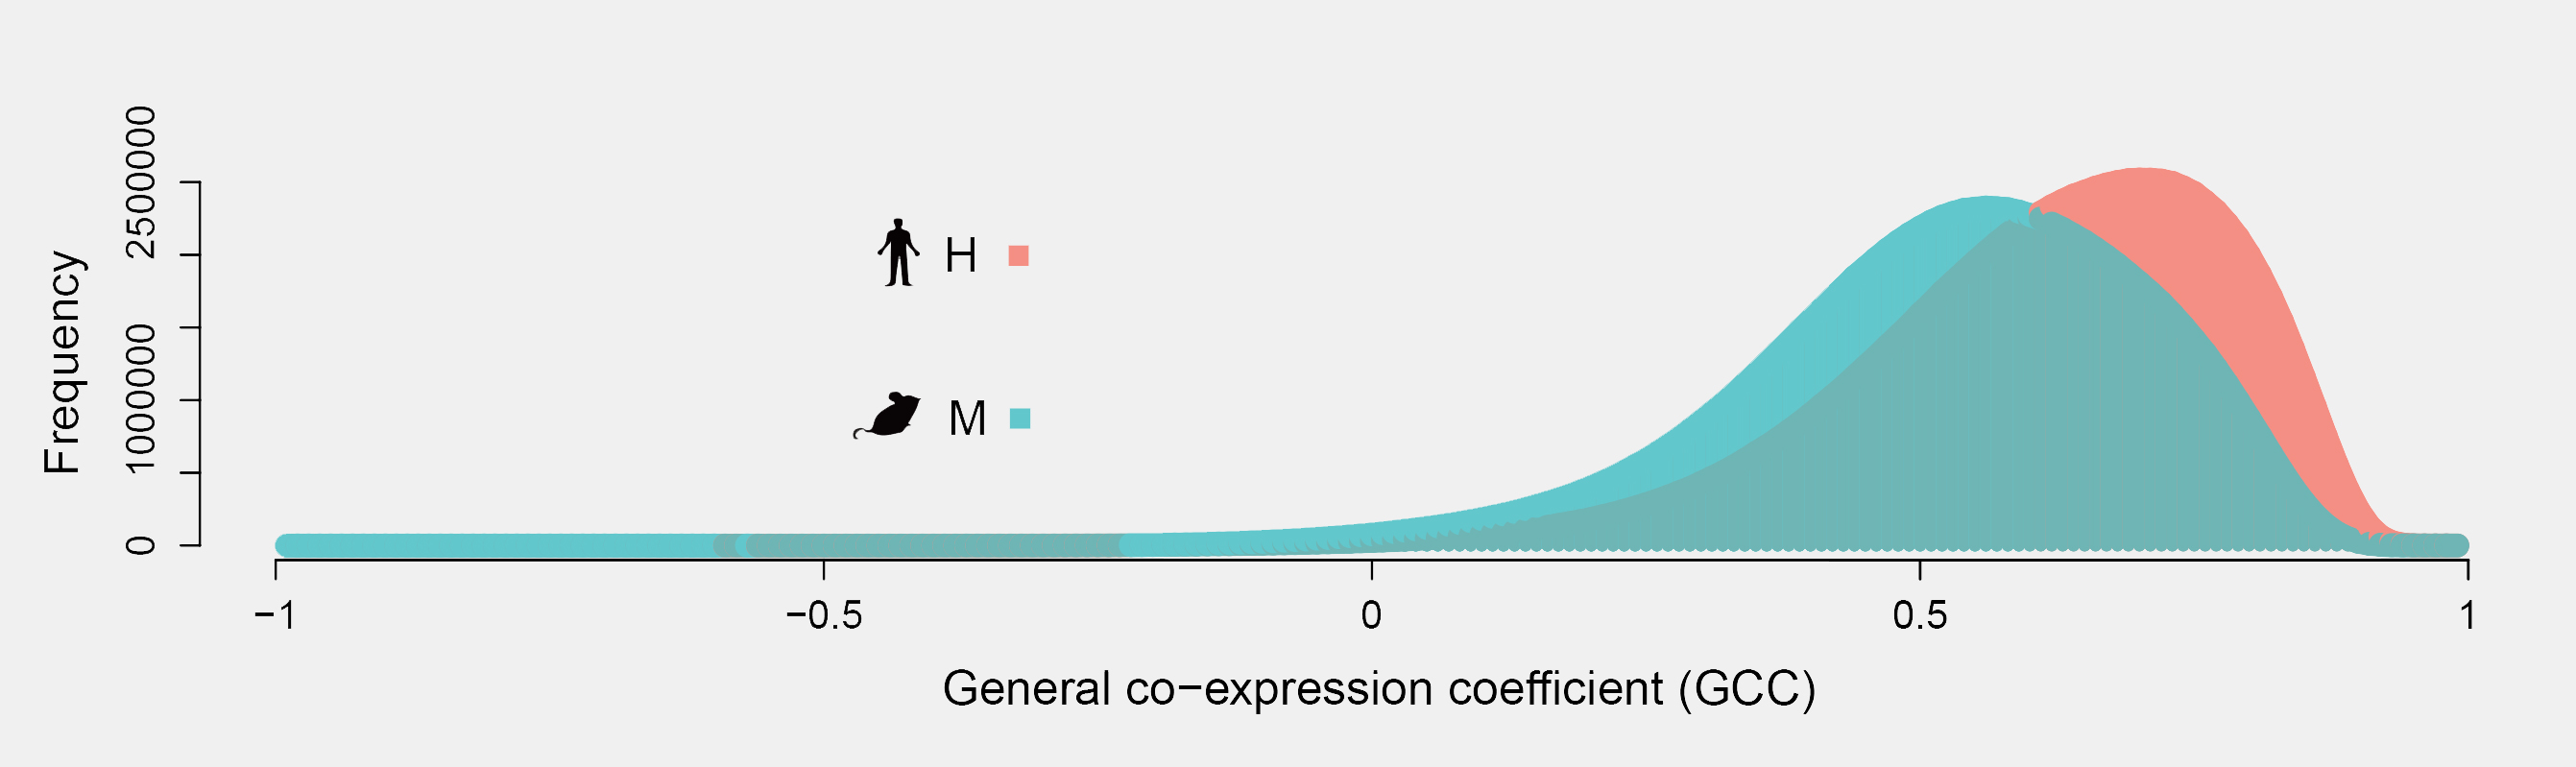
The murine model always serves as an important experimental system for biomedical science for it has a high degree of similarities at the sequence level with human. Here, we reviewed the comparison of the transcriptional landscapes between human and mouse However, there only about 36.54% of the co-expression relationships are conserved between the two species. So, we conduct the database helping the researcherspay attention to these differences when they carry out their study using the expression data of the human and mouse.
1. Search the co-expression data of the gene between human and mouse.
2. Download the data you need.
The percentage of the robust co-expression relationships
Type
Set pair
Total gene-pairs
Robust gene-pairs
Percentage
Within species
H1-H2
102681615
101705904
99.05%
Within species
M1-M2
102681615
100738682
98.11%
Between species
H1-M1
102681615
38318106
37.32%
Between species
H1-M2
102681615
35787977
34.85%
Between species
H2-M1
102681615
36545838
35.59%
Between species
H2-M2
102681615
33909021
33.02%
Between species
H - M
102681615
37518602
36.54%
Data Format
Human general co-expression data
We provide the human general co-expression data to download such as the data below.
MYO1F HCFC1 0.428 MYO1F FAM198B 0.367 MYO1F EPM2A 0.288 MYO1F ZCCHC24 0.021 MYO1F ACOT4 0.283 MYO1F THEG 0.342 MYO1F CA3 -0.007 MYO1F HIST1H1T 0.421 MYO1F AFF2 0.254 MYO1F ARID1B 0.553 MYO1F JMJD8 0.401 MYO1F PAIP2 0.635 MYO1F FKBP5 0.591 MYO1F LRPAP1 0.415
Mouse general co-expression data format
We provide the mouse general co-expression data to download such as the data below.
Myo1f Hcfc1 0.534 Myo1f Fam198b 0.306 Myo1f Epm2a 0.475 Myo1f Zcchc24 0.274 Myo1f Acot4 0.262 Myo1f Theg 0.356 Myo1f Car3 0.12 Myo1f Hist1h1t 0.556 Myo1f Aff2 0.298 Myo1f Arid1b 0.51 Myo1f Jmjd8 0.385 Myo1f Paip2 0.505 Myo1f Fkbp5 0.496 Myo1f Lrpap1 0.387
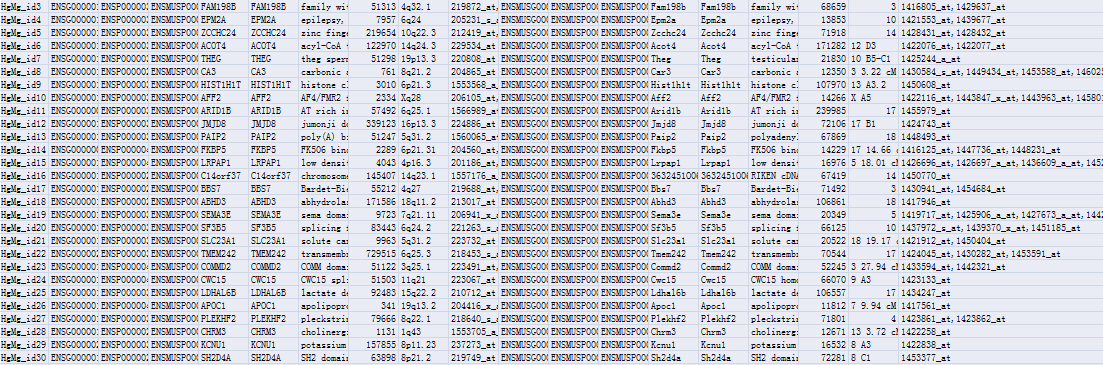
Homogene data format between human and mouse
We provide the mouse general co-expression data to download such as the data below.
Supplementary files
Supplementary file S1 : H1,H2,M1,M2-module.zip (97k)
Supplementary file S2 : GO annotation results for the top 5% ~ 50% genes with high-degree.zip (217k)
Supplementary file S3 : gene_substitution_analysis_result.zip (213k)