| | Case-control association t-test(case/control or binomial phenotype) |
| | Carry out linear regression analysis (continuous phenotype) |
| | Carry out logistic regression analysis(case/control or binomial phenotype) |
| | Calculate the Pearson's correlation coefficients (continuous phenotype) |
| | Convert DNA methlytion beta-value to SMP menoypte (MM MU or UU) |
| | Chisq-square test for epi-allele 2 (phenotype)*2 ( M vs. U) table |
| | Identify the type of SMP allele association for each DNA methylation loci |
| Calculate the MAF and Hady-Weinberg pvalue for each DNA methylation loci | |
| Give a summary statistic for each DNA methylation loci |
| Epigenome-wide meplotype association test | |
| | Calculated the MD coefficient MD-prime and MD r-square |
| | Identify the MD blocks and calculate the frequency of meplotype |
| Calculate the frequency of methylecomtypes in MD block rigion | |
| calculated the general MD coefficient gD-prime and gr-square | |
| Identify the general MD blocks and calculate the frequency of methylecomtype |
| Carry out epigenome wide meta-analysis |
| Calculate the frequency of methylecomtypes in MD block rigion(default:'matrix') | |
| The sliding window's size(default:20) | |
| Specify a threshold to change the beta-values into two level(H and L) | |
| Do not sort the DNA methylation loci |
EWAS can carry out T test for single DNA methylation locus and calculate the Tp values
java -jar ewas.jar -t.test -input example_ewas.txt
or
java -jar ewas.jar -t.test -input example_ewas.txt -output outFile
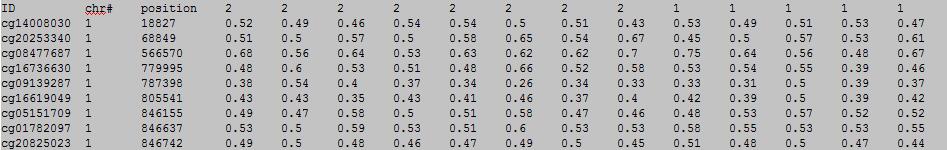
input file :
please see example_ewas.txt or download example_ewas.zip for more information.
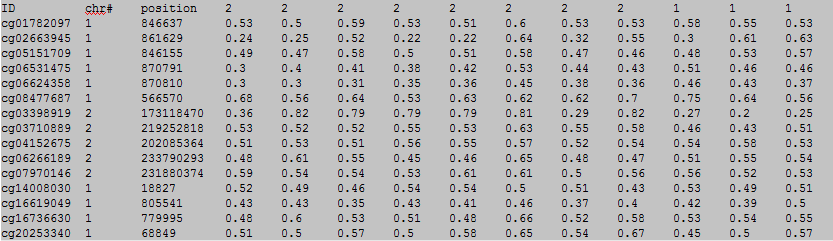
The first row in EWAS input data file is the header line. From the fourth to the last is the status of sample.
From the fourth to the last:
0: unknown/miss
1: unaffected/normal/control group
2: affected/disease/case group
column 1: (e.g. cg00000165) is the ID or name of a DNA methylation locus.
column 2: (e.g. chr1) represents the chromosome number of the DNA methylation locus.
column 3: (e.g. 91194674) represents physical position of the DNA methylation locus.
form column 4 to end: (e.g. 0.492 0.708 0.483 etc.) represents the beta-value of samples in the DNA methylation locus.
OutFile :
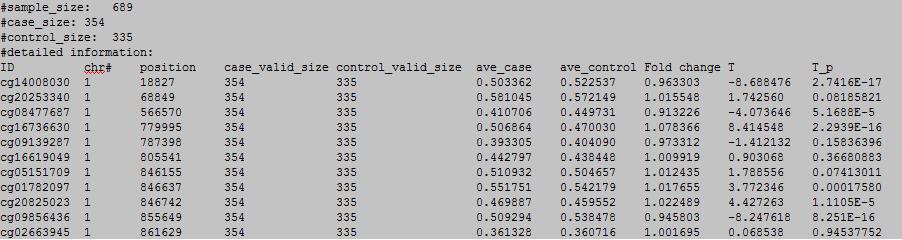
column 1: the ID of the DNA methylation locus.
column 2: chromosome number.
column 3: physical position of the DNA methylation locus.
column 4: the number of valid case samples.
column 5: the number of valid control samples.
column 6: the average of DNA methylation level in case samples.
column 4: the average of DNA methylation level in control samples.
column 5: Fold change.
column 6: T statistic.
column 7: p value.
EWAS can Carry out simple linear regression analysis for each methylation loci with continuous phenotypes.
java -jar ewas.jar -linear -input example_linear.txt
or
java -jar ewas.jar -linear -input example_linear.txt -output outFile
input file :
please see example_linear.txt or download example_linear.zip for more information.

The first row in EWAS input data file is the header line. From the fourth to the last is the continuous phenotype of sample, such as : age
column 1: (e.g. cg00000165) is the ID or name of a DNA methylation locus.
column 2: (e.g. chr1) represents the chromosome number of the DNA methylation locus.
column 3: (e.g. 91194674) represents physical position of the DNA methylation locus.
form column 4 to end: (e.g. 0.492 0.708 0.483 etc.) represents the beta-value of samples in the DNA methylation locus.
OutFile :
column 1: the ID of the DNA methylation locus.
column 2: chromosome number.
column 3: physical position of the DNA methylation locus.
column 4: total sample number.
column 5: valid sample number.
column 6: missing rate.
column 7: linear regression coefficient.
column 8: standard error.
column 9: p value.
EWAS can Carry out logistic regression analysis for each methylation loci with binomial phenotype.
java -jar ewas.jar -logistic -formula phenotype~marker -input example_logistic.txt
or
java -jar ewas.jar -logistic -formula phenotype~marker -input example_logistic.txt -output outFile
input file :
please see example_logistic.txt or download example_logistic.zip for more information.
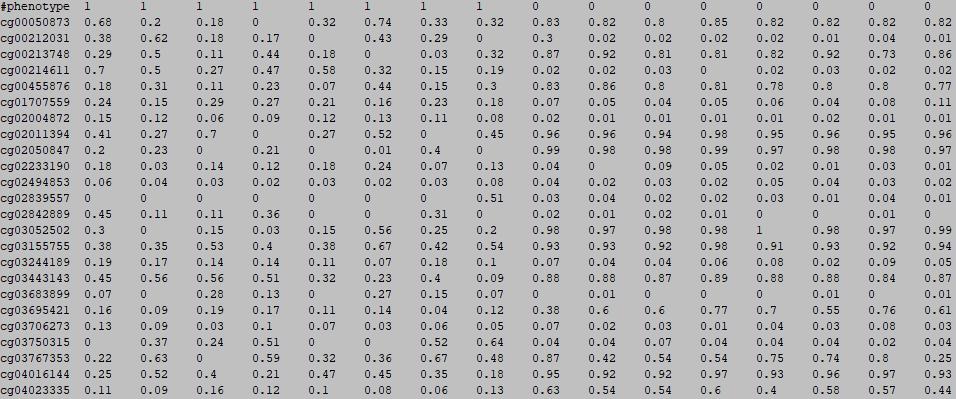
The first row in EWAS input data file, with a phenotype name starting with "#",is the header line. From the fourth to the last is the phenotype of sample, such as disease state.
1: case
0: control
column 1: (e.g. cg00000165) is the ID or name of a DNA methylation locus.
form column 2 to end: (e.g. 0.492 0.708 0.483 etc.) represents the beta-value of samples in the DNA methylation locus.
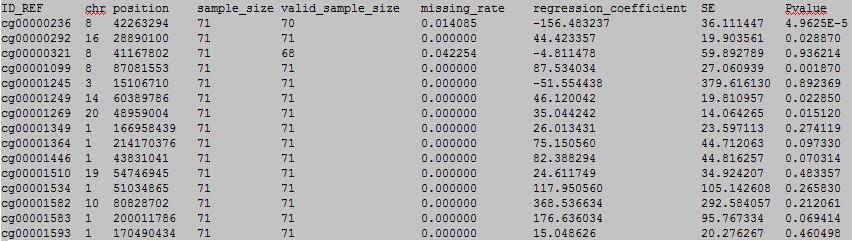
OutFile :
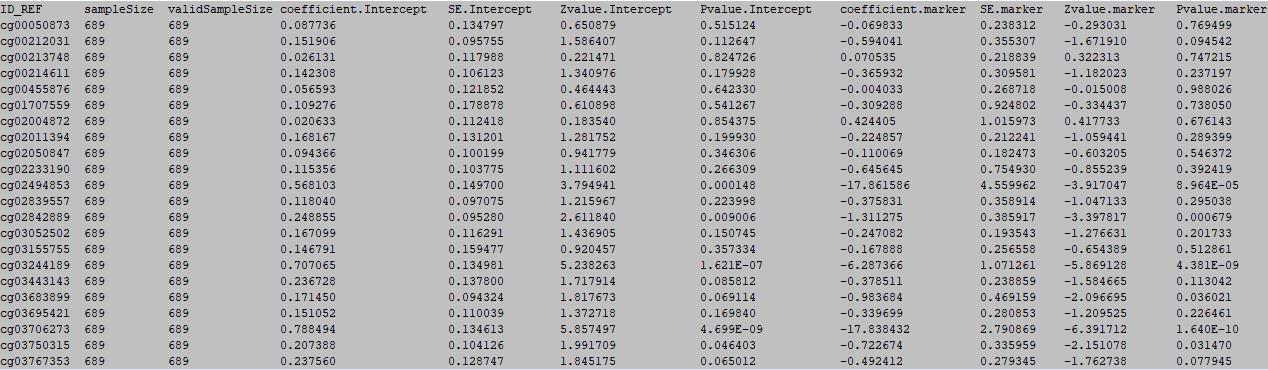
column 1: the ID of the DNA methylation locus.
column 2: total sample number.
column 3: valid sample number.
column 4: intercept.
column 5: standard error of intercept.
column 6: Zvalue of intercept.
column 7: Pvalue of intercept.
column 8: marker's logistic regression coefficient.
column 9: standard error of marker's logistic regression coefficient.
column 10: Zvalue of logistic marker's regression coefficient.
column 11: p value of logistic marker's regression coefficient.
EWAS can Calculate the Pearson's correlation coefficients for each methylation loci with continuous phenotype.
java -jar ewas.jar -cor -input example_cor.txt
or
java -jar ewas.jar -cor -input example_cor.txt -output outFile
input file :
please see example_cor.txt or download example_cor.zip for more information.
The first row in EWAS input data file is the header line. From the fourth to the last is the continuous phenotype of sample, such as : age
column 1: (e.g. cg00000165) is the ID or name of a DNA methylation locus.
column 2: (e.g. chr1) represents the chromosome number of the DNA methylation locus.
column 3: (e.g. 91194674) represents physical position of the DNA methylation locus.
form column 4 to end: (e.g. 0.492 0.708 0.483 etc.) represents the beta-value of samples in the DNA methylation locus.
OutFile :
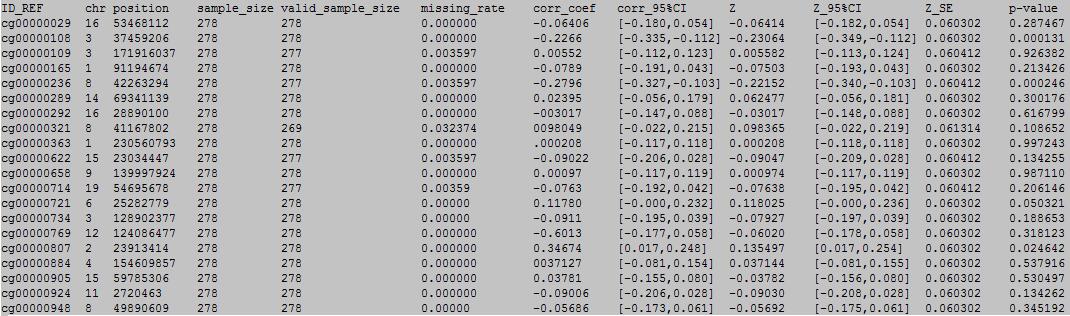
column 1: the ID of the DNA methylation locus.
column 2: chromosome number.
column 3: physical position of the DNA methylation locus.
column 4: total sample number.
column 5: valid sample number.
column 6: missing rate.
column 7: Pearson's correlation coefficient.
column 8: 95% CI of Pearson's correlation coefficient.
column 9: z value.
column 10: 95% CI of z value.
column 11: standard error of z value.
column 12: p value of z value.
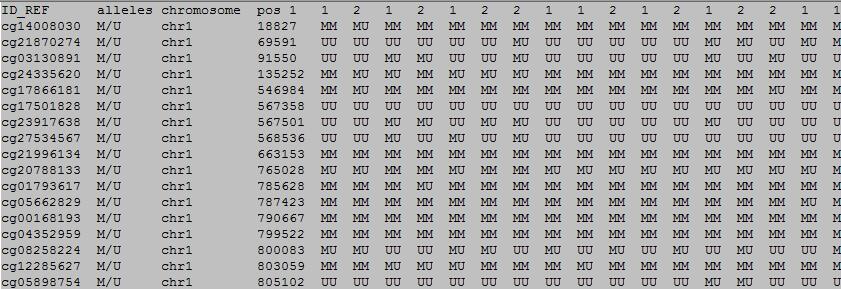
EWAS can Convert DNA methlytion beta-value to SMP menoypte use two threshold.
java -jar ewas.jar -SMP.convert -input example_ewas.txt
or
java -jar ewas.jar -SMP.convert -input example_ewas.txt -output outFile -threshold 0.3 0.7
input file :
please see example_ewas.txt or download example_ewas.zip for more information.
The first row in EWAS input data file is the header line. From the fourth to the last is the status of sample.
0: unknown/miss 1: unaffected/normal/control group 2: affected/disease/case group column 1: (e.g. cg00000165) is the ID or name of a DNA methylation locus.
column 2: (e.g. chr1) represents the chromosome number of the DNA methylation locus.
column 3: (e.g. 91194674) represents physical position of the DNA methylation locus.
form column 4 to end: (e.g. 0.492 0.708 0.483 etc.) represents the beta-value of samples in the DNA methylation locus.
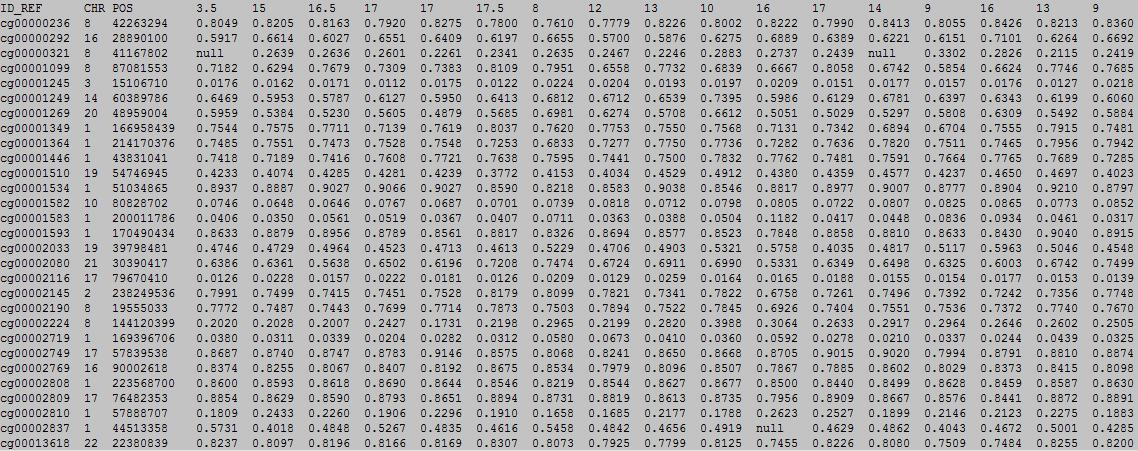
OutFile :
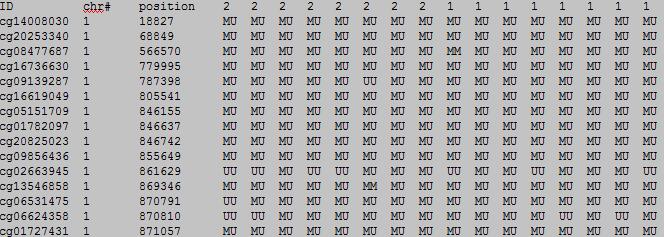
The first row in EWAS input data file is the header line. From the fourth to the last is the status of sample.
0: unknown/miss
1: unaffected/normal/control group
2: affected/disease/case group
column 1: (e.g. cg00000165) is the ID or name of a DNA methylation locus.
column 2: (e.g. chr1) represents the chromosome number of the DNA methylation locus.
column 3: (e.g. 91194674) represents physical position of the DNA methylation locus.
form column 4 to end: (e.g. MU etc.) represents the mplotype of samples in the DNA methylation locus.
EWAS can Carry out Chisq-square test for SMP meplotypes , 2 (phenotype)*2 ( M vs. U) table.
java -jar ewas.jar -SMP.allele_chisq -input out_smp.txt
or
java -jar ewas.jar -SMP.allele_chisq -input out_smp.txt -output outFile
input file :
please see out_smp.txt or download out_smp.zip for more information.
The first row in EWAS input data file is the header line. From the fourth to the last is the status of sample.
0: unknown/miss
1: unaffected/normal/control group
2: affected/disease/case group
column 1: (e.g. cg00000165) is the ID or name of a DNA methylation locus.
column 2: (e.g. chr1) represents the chromosome number of the DNA methylation locus.
column 3: (e.g. 91194674) represents physical position of the DNA methylation locus.
form column 4 to end: (e.g. MU etc.) represents the methylation genotype of samples in the DNA methylation locus.
OutFile :
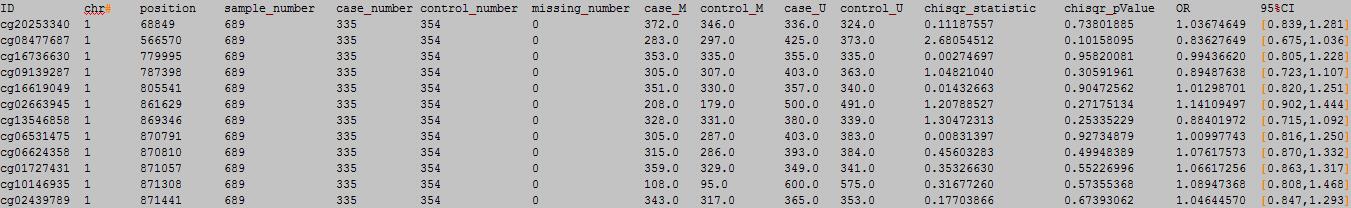
column 1: the ID of the DNA methylation locus.
column 2: chromosome number.
column 3: physical position of the DNA methylation locus.
column 4: total sample number.
column 5: case sample number.
column 6: control sample number.
column 7: missing sample number.
column 8: case M number.
column 9: control M number.
column 10: case U number.
column 11: control U number.
column 12:chisqure statistic.
column 13:chisqure p value.
column 14: OR.
column 15: 95% CI.
| Attention: | for one SMP , if | case | control | |
| M | a | b | ||
| U | c | d |
|
||
| OR>1, risk factor | ||
| OR=1, has no effect | ||
| OR<1, protective factor |
EWAS can Identify the type of SMP allele association for each DNA methylation loci.
java -jar ewas.jar -SMP.aa -input out_smp.txt
or
java -jar ewas.jar -SMP.aa -input out_smp.txt -output outFile
input file :
please see out_smp.txt or download out_smp.zip for more information.
The first row in EWAS input data file is the header line. From the fourth to the last is the status of sample.
0: unknown/miss
1: unaffected/normal/control group
2: affected/disease/case group
column 1: (e.g. cg00000165) is the ID or name of a DNA methylation locus.
column 2: (e.g. chr1) represents the chromosome number of the DNA methylation locus.
column 3: (e.g. 91194674) represents physical position of the DNA methylation locus.
form column 4 to end: (e.g. MU etc.) represents the mplotype of samples in the DNA methylation locus.
OutFile :
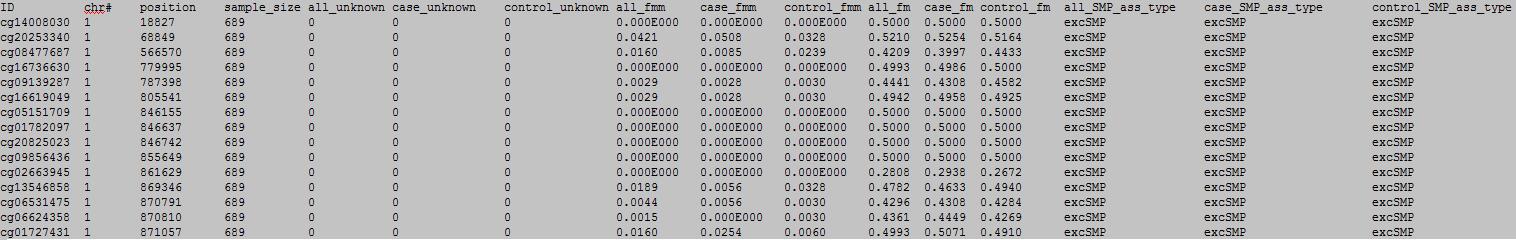
column 1: the ID of the DNA methylation locus.
column 2: chromosome number.
column 3: physical position of the DNA methylation locus.
column 4: total sample number.
column 5: total sample number with unkown information.
column 6: case sample number with unkown information.
column 7: control sample number with unkown information.
column 8: total number ratio with MM meplotype.
column 9: case number ratio with MM meplotype.
column 10: control number ratio with MM meplotype.
column 11: total number ratio of M.
column 12: case number ratio of M.
column 13: control number ratio of M.
column 14: SMP association type.
column 15: case SMP association type.
column 16: control SMP association type.
EWAS can Calculate the MAF and Hady-Weinberg pvalue for each DNA methylation loci.
java -jar ewas.jar -SMP.HW -input out_smp.txt
or
java -jar ewas.jar -SMP.HW -input out_smp.txt -output outFile
input file :
please see out_smp.txt or download out_smp.zip for more information.
The first row in EWAS input data file is the header line. From the fourth to the last is the status of sample.
0: unknown/miss
1: unaffected/normal/control group
2: affected/disease/case group
column 1: (e.g. cg00000165) is the ID or name of a DNA methylation locus.
column 2: (e.g. chr1) represents the chromosome number of the DNA methylation locus.
column 3: (e.g. 91194674) represents physical position of the DNA methylation locus.
form column 4 to end: (e.g. MU etc.) represents the mplotype of samples in the DNA methylation locus.
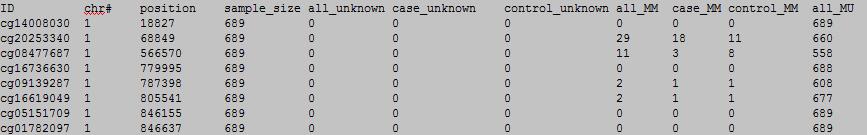
OutFile :
column 1-11:
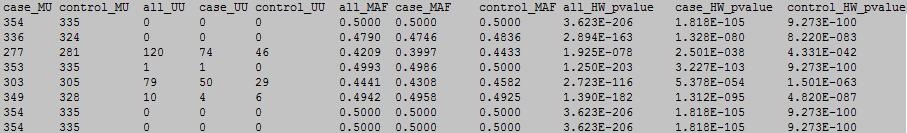
column 12-22:
column 1: the ID of the DNA methylation locus.
column 2: chromosome number.
column 3: physical position of the DNA methylation locus.
column 4: total sample number.
column 5: all sample number with unkown meplotype.
column 6: case sample number with unkown meplotype.
column 7: control sample number with unkown meplotype.
column 8: all sample number with MM meplotype.
column 9: case sample number with MM meplotype.
column 10: control sample number with MM meplotype.
column 11: all sample number with MU meplotype.
column 12: case sample number with MU meplotype.
column 13: control sample number with MU meplotype.
column 14: all sample number with UU meplotype.
column 15: case sample number with UU meplotype.
column 16: control sample number with UU meplotype.
column 17: MAF.
column 18: case MAF.
column 19: control MAF.
column 20: Hady-Weinberg p value.
column 21: case Hady-Weinberg p value.
column 22: control Hady-Weinberg p value.
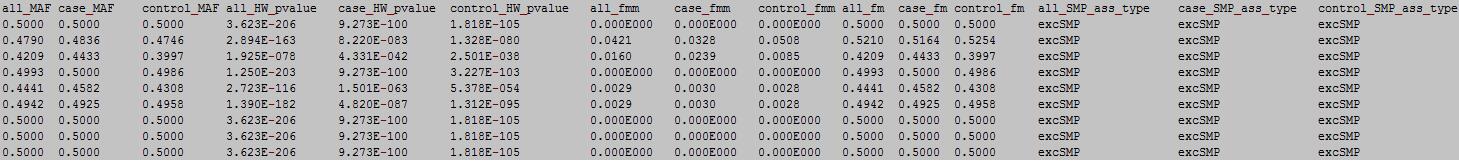
EWAS can Give a summary statistic for each DNA methylation loci.
java -jar ewas.jar -SMP.summary -input out_smp.txt
or
java -jar ewas.jar -SMP.summary -input out_smp.txt -output outFile
input file :
please see out_smp.txt or download out_smp.zip for more information.
The first row in EWAS input data file is the header line. From the fourth to the last is the status of sample.
0: unknown/miss
1: unaffected/normal/control group
2: affected/disease/case group
column 1: (e.g. cg00000165) is the ID or name of a DNA methylation locus.
column 2: (e.g. chr1) represents the chromosome number of the DNA methylation locus.
column 3: (e.g. 91194674) represents physical position of the DNA methylation locus.
form column 4 to end: (e.g. MU etc.) represents the mplotype of samples in the DNA methylation locus.
OutFile :
column 1-16:
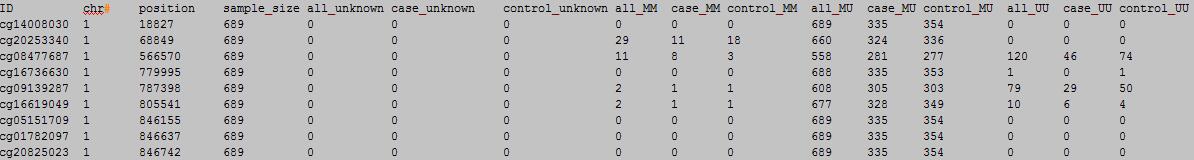
column 17-31:
column 1: the ID of the DNA methylation locus.
column 2: chromosome number.
column 3: physical position of the DNA methylation locus.
column 4: total sample number.
column 5: all sample number with unkown meplotype.
column 6: case sample number with unkown meplotype.
column 7: control sample number with unkown meplotype.
column 8: all sample number with MM meplotype.
column 9: case sample number with MM meplotype.
column 10: control sample number with MM meplotype.
column 11: all sample number with MU meplotype.
column 12: case sample number with MU meplotype.
column 13: control sample number with MU meplotype.
column 14: all sample number with UU meplotype.
column 15: case sample number with UU meplotype.
column 16: control sample number with UU meplotype.
column 17: MAF.
column 18: case MAF.
column 19: control MAF.
column 20: Hady-Weinberg p value.
column 21: case Hady-Weinberg p value.
column 22: control Hady-Weinberg p value.
column 23: total number ratio with MM meplotype.
column 24: case number ratio with MM meplotype.
column 25: control number ratio with MM meplotype.
column 26: total number ratio of M.
column 27: case number ratio of M.
column 28: control number ratio of M.
column 29: SMP association type.
column 30: case SMP association type.
column 31: control SMP association type.
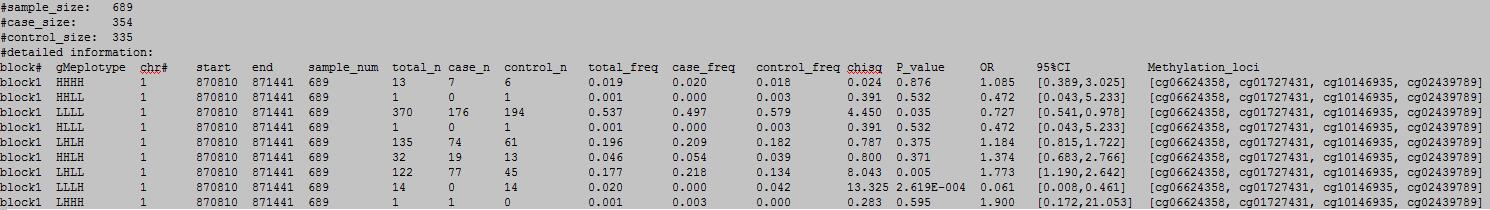
EWAS can scan the entire genome and identify the association between combinations of methylation levels (meplotype) and diseases.
java -jar ewas.jar -meplotype -input example_meplotype.txt
or
java -jar ewas.jar -meplotype -input example_meplotype.txt -output outFile
input file :
please see example_meplotype.txt or download example_meplotype.zip for more information.
The first row in EWAS input data file is the header line. From the fourth to the last is the status of sample.
From the fourth to the last:
0: unknown/miss
1: unaffected/normal/control group
2: affected/disease/case group
column 1: (e.g. cg00000165) is the ID or name of a DNA methylation locus.
column 2: (e.g. M/U) represents the methylation status of the DNA methylation locus.
column 3: (e.g. chr1) represents the chromosome number of the DNA methylation locus.
column 4: (e.g. 91194674) represents physical position of the DNA methylation locus.
form column 5 to end: (e.g. 0.492 0.708 0.483 etc.) represents the methylation genotype in each sample.
OutFile :
column 1-9
column 10-15
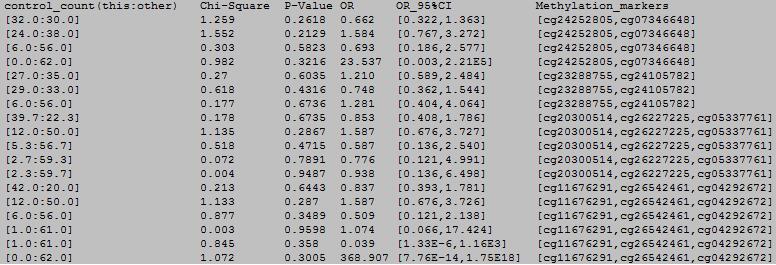
column 1: block number.
column 2: chromosome number.
column 3: the start position.
column 4: the end position.
column 5: the methylation haplotype.
column 6: the total frequency of the methylation haplotype.
column 7: the frequency of the methylation haplotype in case samples.
column 8: the frequency of the methylation haplotype in control samples.
column 9: the number of this methylation haplotype and others in case samples.
column 10: the number of this methylation haplotype and others in control samples.
column 11: the chi-square statistic.
column 12: the P-value of chi-square test.
column 13: OR.
column 14: 95%CI of OR.
column 15: methylation locis in the blocks.
| Attention: | for one meplotype , if | case | control | |
| this meplotype | a | b | ||
| other meplotype | c | d |
|
||
| OR>1, risk factor | ||
| OR=1, has no effect | ||
| OR<1, protective factor |
For a list of DNA methylation loci, EWAS can calculate the MD coefficient D-prime and r-square. We provided two types of output formate: matrix and list.
java –jar ewas.jar -MD -input example_md.txt
or
java –jar ewas.jar -MD -input example_md.txt -MDFormat matrix -output outFile
input file :
please see example_md.txt or download example_md.zip for more information.

The first row in EWAS input data file is the header line. From the fifth to the last is the status of sample.
From the fifth to the last:
0: unknown/miss
1: unaffected/normal/control group
2: affected/disease/case group
column 1: (e.g. cg00000165) is the ID or name of a DNA methylation locus.
column 2: (e.g. M/U) represents the methylation status of the DNA methylation locus.
column 3: (e.g. chr1) represents the chromosome number of the DNA methylation locus.
column 4: (e.g. 91194674) represents physical position of the DNA methylation locus.
form column 5 to end: (e.g. 0.492 0.708 0.483 etc.) represents the methylation status of samples in the DNA methylation locus.
OutFile :
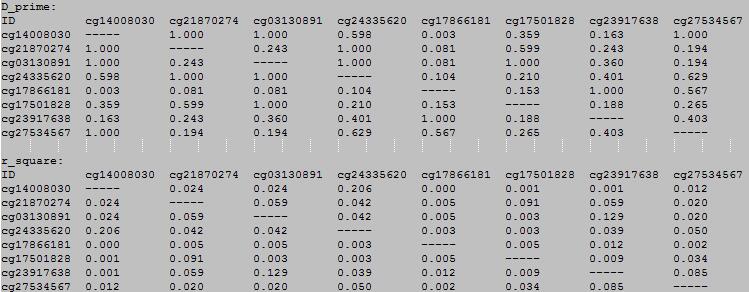
The first row and the first colum for each martrix is the DNA methylation loci. The data in the matrix is D-prime or r-square.
java –jar ewas.jar -MD -input example_md.txt -MDFormat list
or
java –jar ewas.jar -MD -input example_md.txt -MDFormat list -output outFile
OutFile :
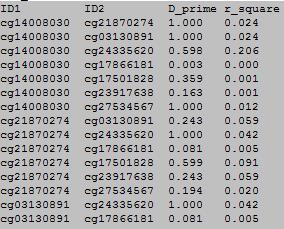
column 1: is the ID of the first DNA methylation locus.
column 2: is the ID of the second DNA methylation locus.
column 3: is the MD coefficient D-prime.
column 4: is the MD coefficient and r-square.
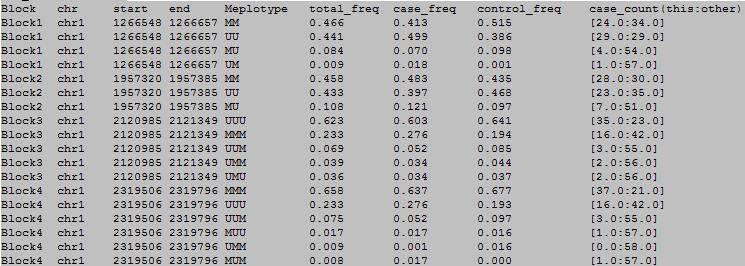
EWAS can identify the MD blocks and calculate the frequency of meplotype in the blocks.
java –jar ewas.jar –block -input example_meplotype.txt
or
java –jar ewas.jar –block -input example_meplotype.txt -output outFile
input file :
please see example_meplotype.txt or download example_meplotype.zip for more information.
The first row in EWAS input data file is the header line. From the fifth to the last is the status of sample.
From the fifth to the last:
0: unknown/miss
1: unaffected/normal/control group
2: affected/disease/case group
column 1: (e.g. cg00000165) is the ID or name of a DNA methylation locus.
column 2: (e.g. M/U) represents the methylation status of the DNA methylation locus.
column 3: (e.g. chr1) represents the chromosome number of the DNA methylation locus.
column 4: (e.g. 91194674) represents physical position of the DNA methylation locus.
form column 5 to end: (e.g. 0.492 0.708 0.483 etc.) represents the methylation status of samples in the DNA methylation locus.
OutFile :
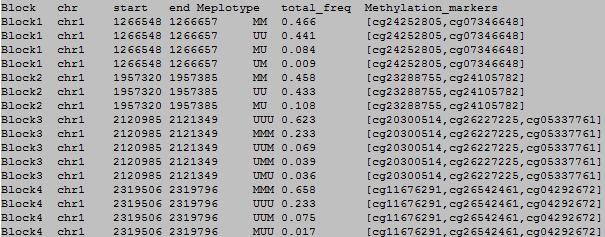
column 1: block#.
column 2: chromosome number.
column 3: start position of the block.
column 4: end position of the block.
column 5: the meplotype in blocks.
column 6: frequency of methylecomtype in total sapmles.
column 7: methylation loci in the blocks.
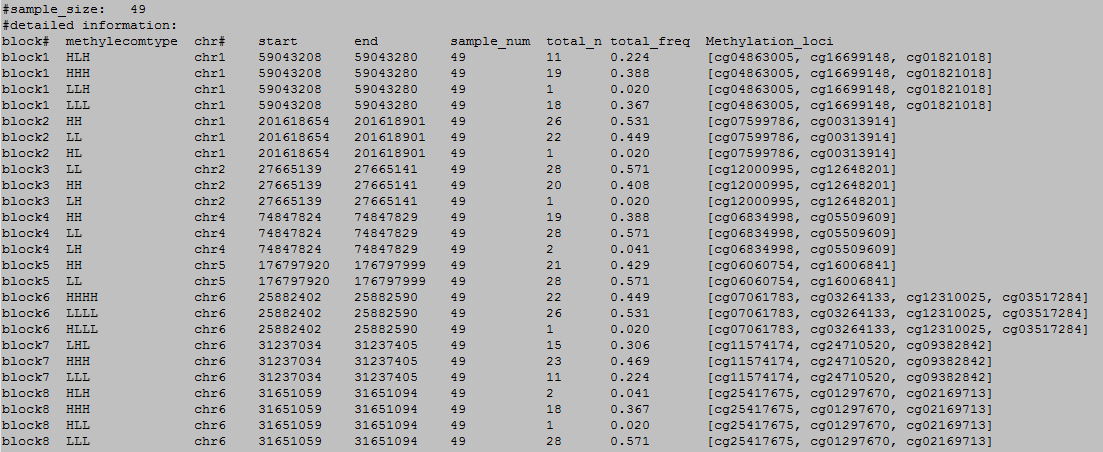
EWAS can scan the entire genome and identify the association between combinations of methylation levels (methylecomtype) and diseases.
java -jar ewas.jar -methylocomtype -input example_ewas.txt
or
java -jar ewas.jar -methylocomtype -WindowSize 20 -input example_ewas.txt -threshold 0.5 -output outFile
input file :
please see example_ewas.txt or download example_ewas.zip for more information.
The first row in EWAS input data file is the header line. From the fourth to the last is the status of sample.
From the fourth to the last:
0: unknown/miss
1: unaffected/normal/control group
2: affected/disease/case group
column 1: (e.g. cg00000165) is the ID or name of a DNA methylation locus.
column 2: (e.g. chr1) represents the chromosome number of the DNA methylation locus.
column 3: (e.g. 91194674) represents physical position of the DNA methylation locus.
form column 4 to end: (e.g. 0.492 0.708 0.483 etc.) represents the beta-value of samples in the DNA methylation locus.
OutFile :
column 1: block#.
column 2: the methylecomtype in blocks.
column 3: chromosome number.
column 4: the start position.
column 5: the end position.
column 6: the total sample number.
column 7: the number of methylecomtype in total sapmles.
column 8: the number of methylecomtype in cases.
column 9: the number of methylecomtype in controls.
column 10: frequency of methylecomtype in total sapmles.
column 11: frequency of methylecomtype in cases.
column 12: frequency of methylecomtype in controls.
column 13: the chi-square statistic.
column 14: the P-value of chi-square test.
column 15: OR.
column 16: 95%CI of OR.
column 17: methylation loci in the blocks.
| Attention: | for one meplotype , if | case | control | |
| this meplotype | a | b | ||
| other meplotype | c | d |
|
||
| OR>1, risk factor | ||
| OR=1, has no effect | ||
| OR<1, protective factor |
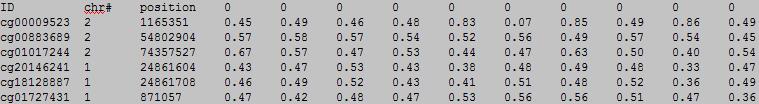
For a list of DNA methylation loci, EWAS can calculate the general MD coefficient gD-prime and gr-square. We provided two types of output formate: matrix and list.
java –jar ewas.jar -gMD -input example_gMD.txt
or
java –jar ewas.jar -gMD -input example_gMD.txt -gMDFormat matrix -output outFile
input file :
please see example_gMD.txt or download example_gMD.zip for more information.
The first row in EWAS input data file is the header line. From the fourth to the last is the status of sample.
From the fourth to the last:
0: unknown/miss
1: unaffected/normal/control group
2: affected/disease/case group
column 1: (e.g. cg00000165) is the ID or name of a DNA methylation locus.
column 2: (e.g. chr1) represents the chromosome number of the DNA methylation locus.
column 3: (e.g. 91194674) represents physical position of the DNA methylation locus.
form column 4 to end: (e.g. 0.492 0.708 0.483 etc.) represents the beta-value of samples in the DNA methylation locus.
OutFile :
The first row and the first colum for each martrix is the DNA methylation loci. The data in the matrix is gD-prime or gr-square.
java –jar ewas.jar -gMD -input example_gMD.txt -gMDFormat list
or
java –jar ewas.jar -gMD -input example_gMD.txt -gMDFormat list -output outFile
OutFile :

column 1: is the ID of the first DNA methylation locus.
column 2: is the ID of the second DNA methylation locus.
column 3: is the MD coefficient gD-prime.
column 4: is the MD coefficient and gr-square.
EWAS can identify the general MD blocks and calculate the frequency of methylecomtype in the blocks.
java –jar ewas.jar –gblock -input example_gblock.txt
or
java –jar ewas.jar –gblock -WindowSize 20 -input example_gblock.txt -thereshold 0.5 -output outFile
input file :
please see example_gblock.txt or download example_gblock.zip for more information.
The first row in EWAS input data file is the header line. From the fourth to the last is the status of sample.
From the fourth to the last:
0 unknown/miss
1: unaffected/normal/control group
2: affected/disease/case group
column 1: (e.g. cg00000165) is the ID or name of a DNA methylation locus.
column 2: (e.g. chr1) represents the chromosome number of the DNA methylation locus.
column 3: (e.g. 91194674) represents physical position of the DNA methylation locus.
form column 4 to end: (e.g. 0.492 0.708 0.483 etc.) represents the beta-value of samples in the DNA methylation locus.
OutFile :
column 1: block#.
column 2: the methylecomtype in blocks.
column 3: chromosome number.
column 4: start position of the block.
column 5: end position of the block.
column 6: the total sample number.
column 7: the number of methylecomtype in total sapmles.
column 8: frequency of methylecomtype in total sapmles.
column 9: methylation loci in the blocks.
We firstly sort the DNA methylation loci based on their physical position. Then change the beta-values into two levels (H: high DNA methylation level and L: low DNA methylation level).
java -jar ewas.jar -sort -input example_ewas.txt
or
java -jar ewas.jar -sort -input example_ewas.txt -output outFile
input file :
please see example_ewas.txt or download example_ewas.zip for more information.
The first row in EWAS input data file is the header line. From the fourth to the last is the status of sample.
0: unknown/miss
1: unaffected/normal/control group
2: affected/disease/case group
column 1: (e.g. cg00000165) is the ID or name of a DNA methylation locus.
column 2: (e.g. chr1) represents the chromosome number of the DNA methylation locus.
column 3: (e.g. 91194674) represents physical position of the DNA methylation locus.
form column 4 to end: (e.g. 0.492 0.708 0.483 etc.) represents the beta-value of samples in the DNA methylation locus.
OutFile :
0: unknown/miss 1: unaffected/normal/control group 2: affected/disease/case group column 1: (e.g. cg00000165) is the ID or name of a DNA methylation locus.
column 2: (e.g. chr1) represents the chromosome number of the DNA methylation locus.
column 3: (e.g. 91194674) represents physical position of the DNA methylation locus.
form column 4 to end: (e.g. 0.492 0.708 0.483 etc.) represents the beta-value of samples in the DNA methylation locus.
EWAS can Give a summary statistic for each DNA methylation loci.
java -jar ewas.jar -meta -input example_meta.txt
or
java -jar ewas.jar -meta -input example_meta.txt -output outFile
input file :
please see example_meta.txt or download example_meta.zip for more information.
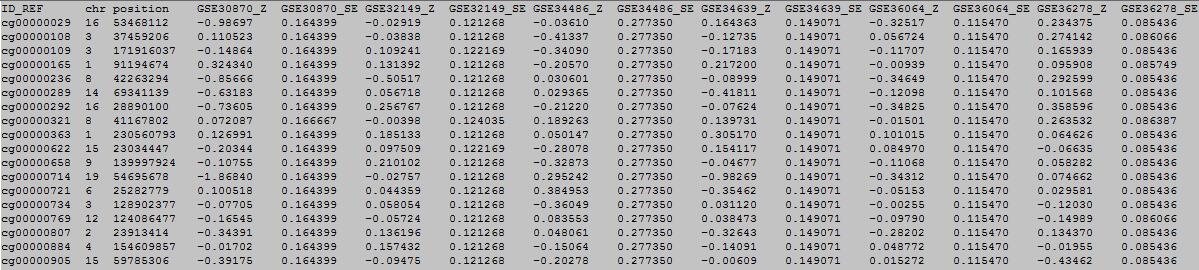
The first row in EWAS input data file is the header line. From the fourth to the last: every two column represent one study.
column 1: (e.g. cg00000165) is the ID or name of a DNA methylation locus.
column 2: (e.g. chr1) represents the chromosome number of the DNA methylation locus.
column 3: (e.g. 91194674) represents physical position of the DNA methylation locus.
form column 4 to end: every two column represent one study, first column is regression coefficients, the next column is its standerd error .
OutFile :
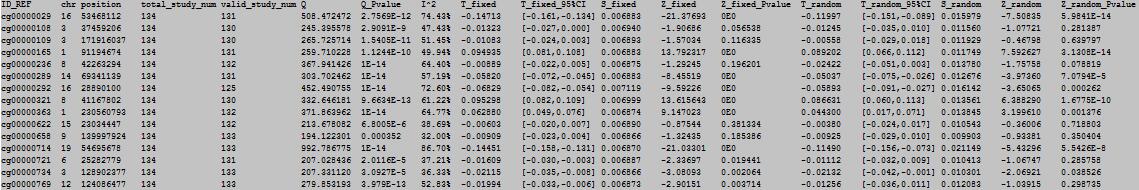
column 1: the ID of the DNA methylation locus.
column 2: chromosome number.
column 3: physical position of the DNA methylation locus.
column 4: total study number.
column 5: valid study number.
column 6: Q-test statistic.
column 7: Q-test p value.
column 8: I2statistic.
column 9: Pooled effect statistics in fixed model.
column 10: 95% CI of pooled effect statistics in fixed model.
column 11: Standard error of pooled effect statistics in fixed model.
column 12: Z-test statistic of pooled effect statistics in fixed model..
column 13: P value for z-test statistic of pooled effect statistics in fixed model..
column 14: Pooled effect statistics in random model.
column 15: 95% CI of pooled effect statistics in random model.
column 16: Standard error of pooled effect statistics in random model.
column 17: Z-test statistic of pooled effect statistics in random model.
column 18: P value for z-test statistic of pooled effect statistics in random model.
| | The input file name |
| | The output file name |
| | Sort the DNA methylation loci |
| | Start analysis without sorting the DNA methylation loci |
| | Case-control association t-test(case/control or binomial phenotype) |
| | Carry out linear regression analysis (continuous phenotype) |
| | Carry out logistic regression analysis(case/control or binomial phenotype) |
| | Calculate the Pearson's correlation coefficients (continuous phenotype) |
| | Convert DNA methlytion beta-value to SMP menoypte (MM MU or UU) |
| | Chisq-square test for SMP meplotypes 2 (phenotype)*2 ( M vs. U) table |
| | Identify the type of SMP allele association for each DNA methylation loci |
| Calculate the MAF and Hady-Weinberg pvalue for each DNA methylation loci | |
| Give a summary statistic for each DNA methylation loci |
| Epigenome-wide meplotype association test | |
| | Calculated the MD coefficient MD-prime and MD r-square |
| | Identify the MD blocks and calculate the frequency of meplotype |
| Calculate the frequency of methylecomtypes in MD block rigion | |
| calculated the general MD coefficient gD-prime and gr-square | |
| Identify the general MD blocks and calculate the frequency of methylecomtype |
| Carry out epigenome wide meta-analysis |
| Calculate the frequency of methylecomtypes in MD block rigion(default:'matrix') | |
| The sliding window's size(default:20) | |
| Specify a threshold to change the beta-values into two level(H and L) | |
| Do not sort the DNA methylation loci |